Sensitivity analysis for Tabular solutions
Contents
Sensitivity analysis for Tabular solutions#
Add a set of perturbations of different magnitudes to the node under consideration
Calculate the corresponding variation of the output
Repeat the process for each node independently
Deduce the common rank of importance of nodes
The Sensitivity analysis give an insider look at the model’s logic and can sometimes reveal that some input features are more important than others. This can lead to changes in the choice of inputs features. If one of input features has a little impact on the outputs, it can be excluded from training. The new training with less input features generally leads to a smaller model without significant loss of accuracy.
The NeurEco Sensitivity analysis is performed in Network sensitivity sections of GUI and proposes two modes:
Sensitivity analysis for a single sample#
Switch to Evaluation panel
Choose the file in Evaluation files section:
If the file was supplied earlier, it is already listed in Evaluation files
To add new file for evaluation, press + in Additional section of Evaluation files
For Sensitivity analysis, the output file is not required
Once the input file clicked (or a pair input/output), choose a sample to study using Sample slider
Click on one of the output neurons (representing output features) on the plot of the neural network in the Network sensitivity section
Each neuron becomes colored according to the sensitivity of the chosen output neurons with respect to this neuron
For the input neurons (representing the input features): click on an input neuron to get the calculated value of sensitivity in addition to color
An example of the sensitivity analysis for a single sample:
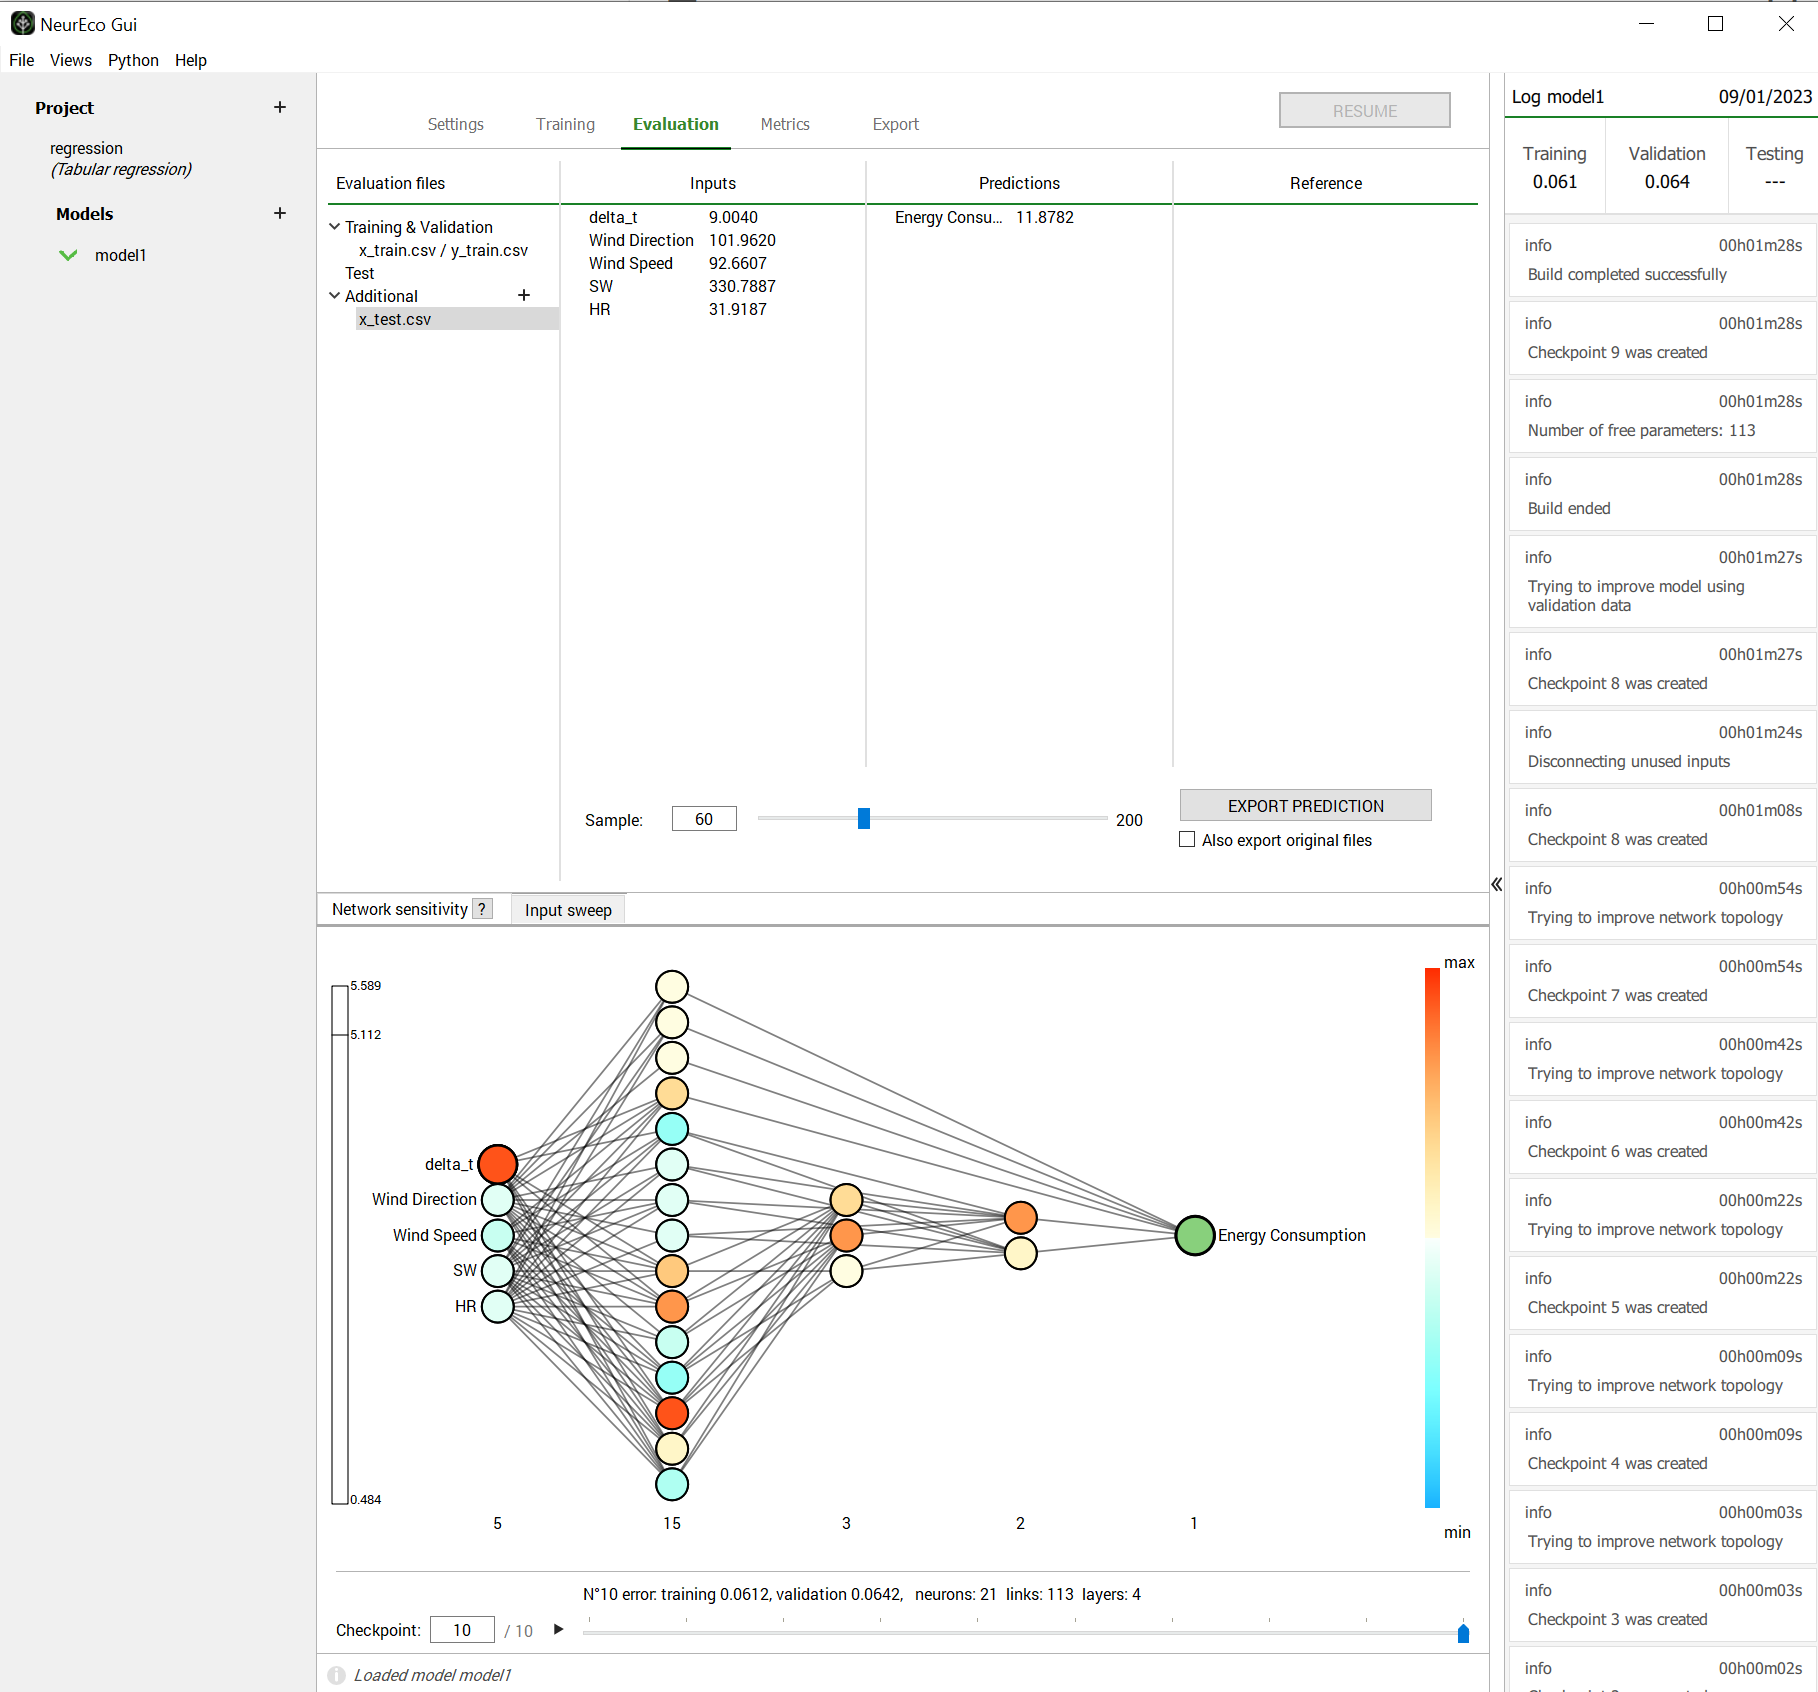
Tabular network sensitivity for a single sample. Regression test case: Energy consumption.#
Note
By default, the Network sensitivity is performed with the last model available in the checkpoint. Use the checkpoint slider in the bottom to choose any other available model.
Sensitivity analysis for a whole dataset#
The sensitivity for a whole dataset is calculated as a norm of sensitivities on each sample in this dataset.
Switch to Metrics panel
Choose the file in Evaluation files section:
If the file was supplied earlier, it is already listed in Evaluation files
To add new file for evaluation, press + in Additional section of Evaluation files
For Sensitivity analysis, the output file is not required
Click on one of the output neurons (representing output features) on the plot of the neural network in the Network sensitivity section
Each neuron becomes colored according to the sensitivity of the chosen output neurons with respect to this neuron
An example of the sensitivity analysis for a single sample:
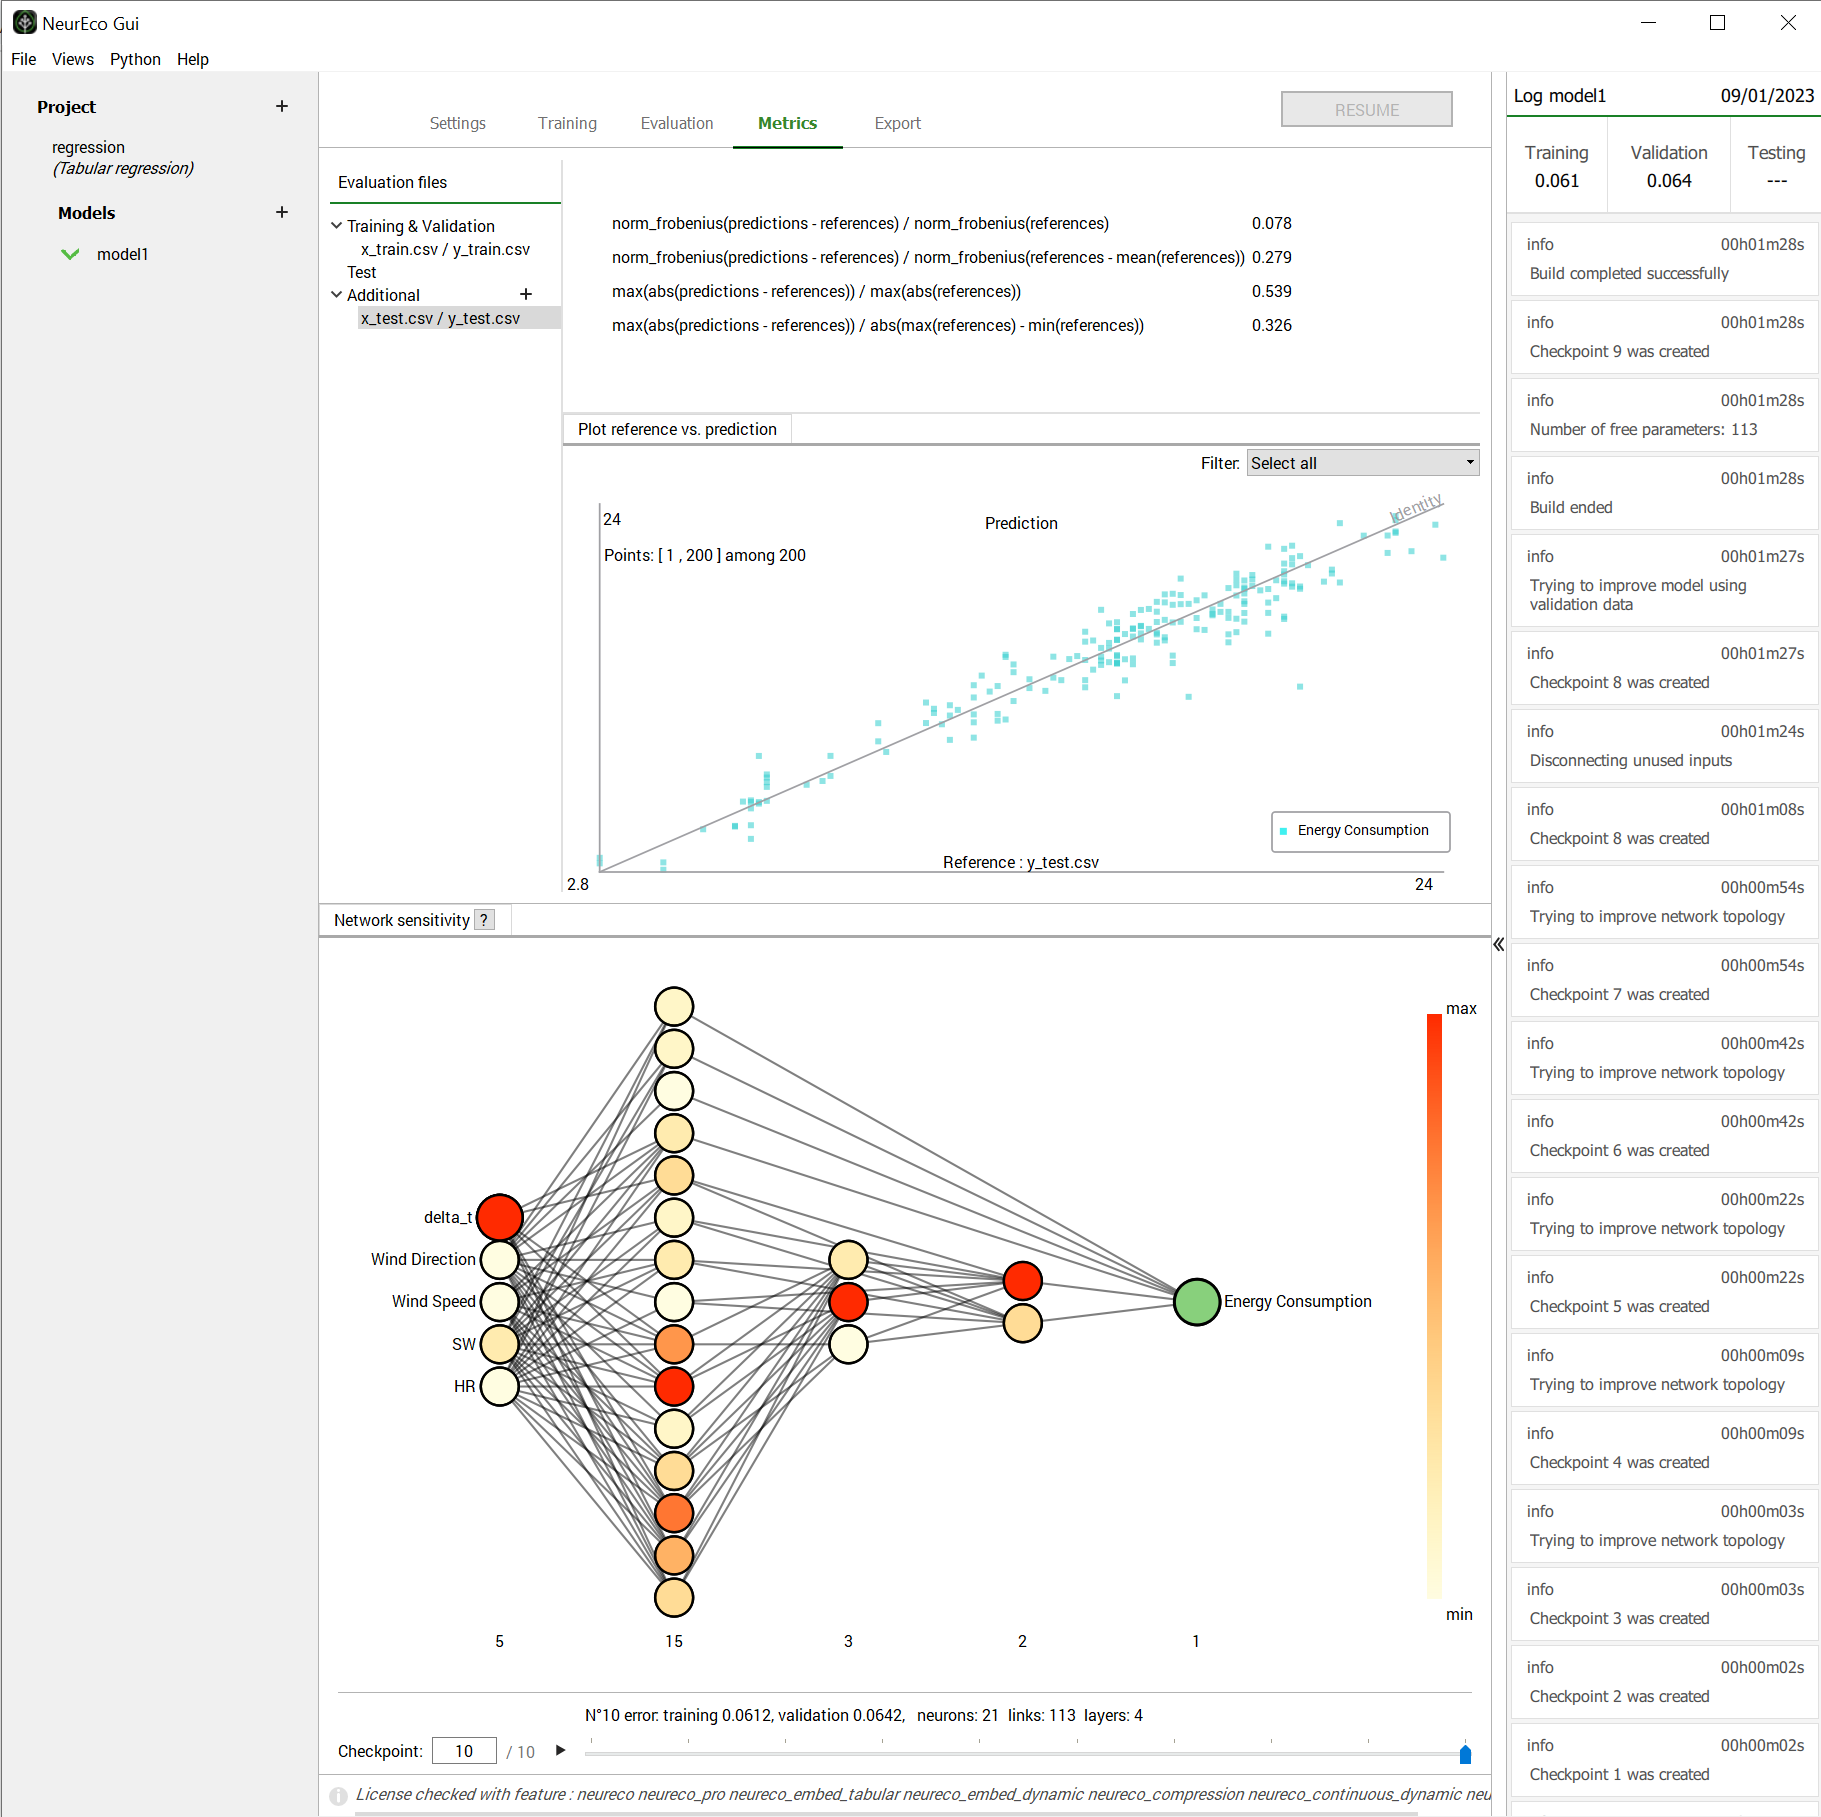
Tabular network sensitivity for a whole dataset. Regression test case: Energy consumption.#
Note
By default, the Network sensitivity is performed with the last model available in the checkpoint. Use the checkpoint slider in the bottom to choose any other available model.