Tutorial: Using NeurEco GUI for a Tabular Compression problem
Tutorial: Using NeurEco GUI for a Tabular Compression problem#
This section uses the test case Heaviside. This test case can be selected directly from the template window of the GUI:
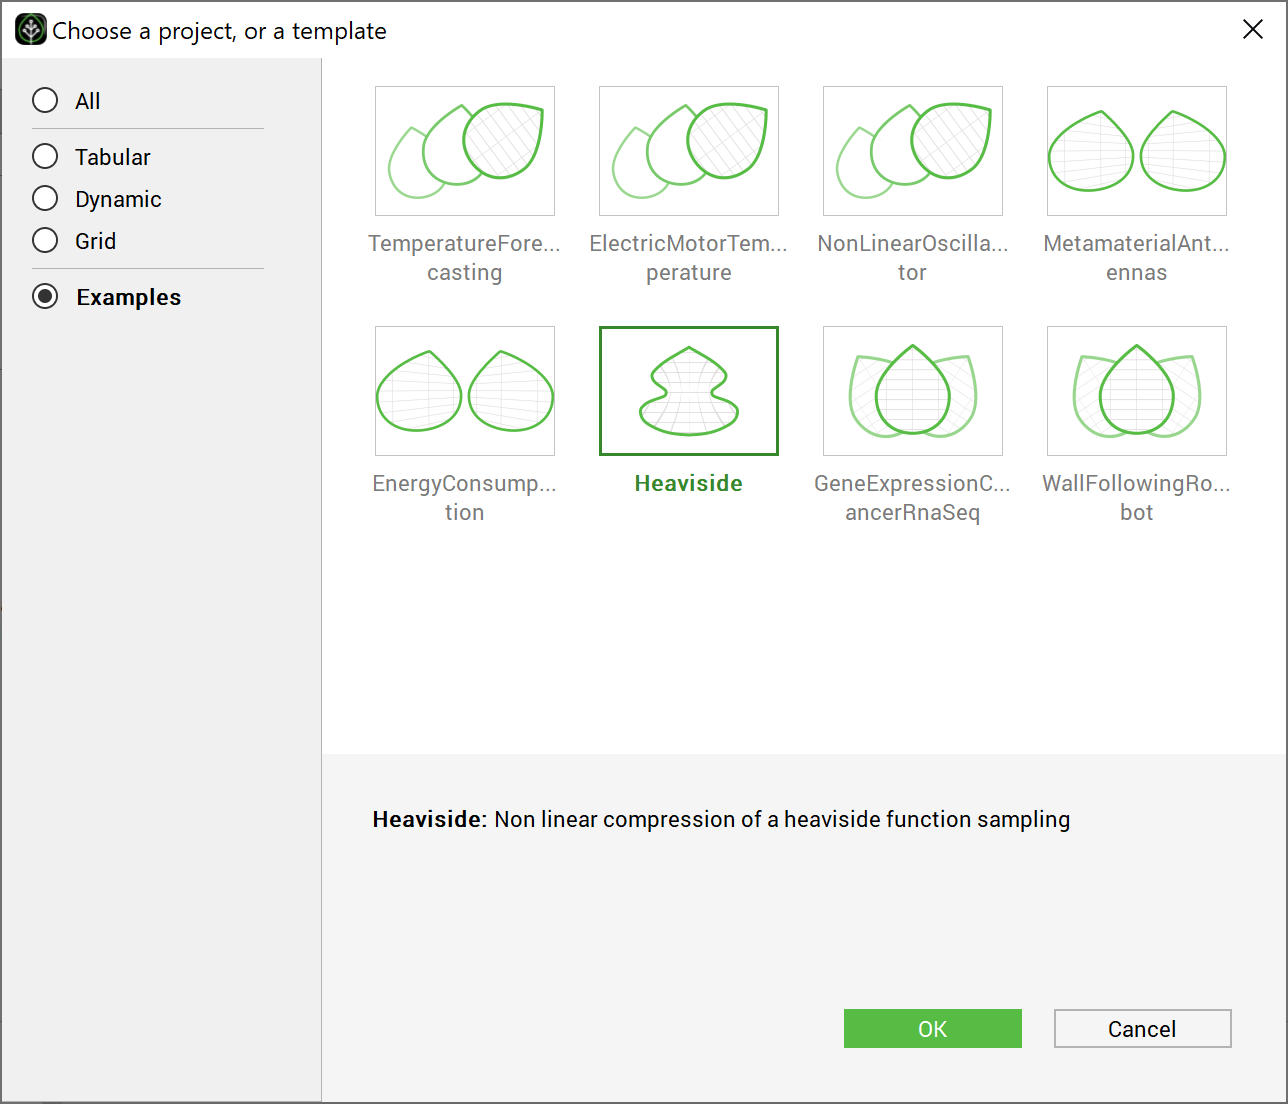
Choosing the test case Heaviside directly from the GUI examples#
Create an empty directory (Heaviside Example), and extract the Heaviside data there. The GUI automatically extracts the data and creates the project in the chosen directory. The created directory contains the following files:
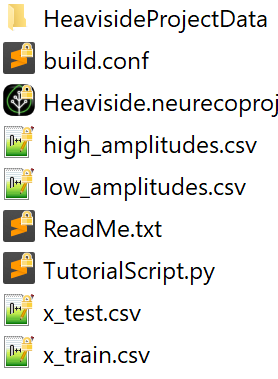
Content of the test case Heaviside from the GUI#
Note
The data for Compression contain only the inputs. They play the role both of the inputs and the targets of the training.
The Heaviside directory is used by the GUI alongside the CSV data files. The rest is used by the other NeurEco interfaces.
Note
To create the GUI project without using the template window, create a new directory called Heaviside and copy the data CSV files into it. Go to the File menu, and click New, then choose the Tabular solution and the Compression template. Choose the name of the project and the name of the model as: Heaviside and Heaviside and click ok.
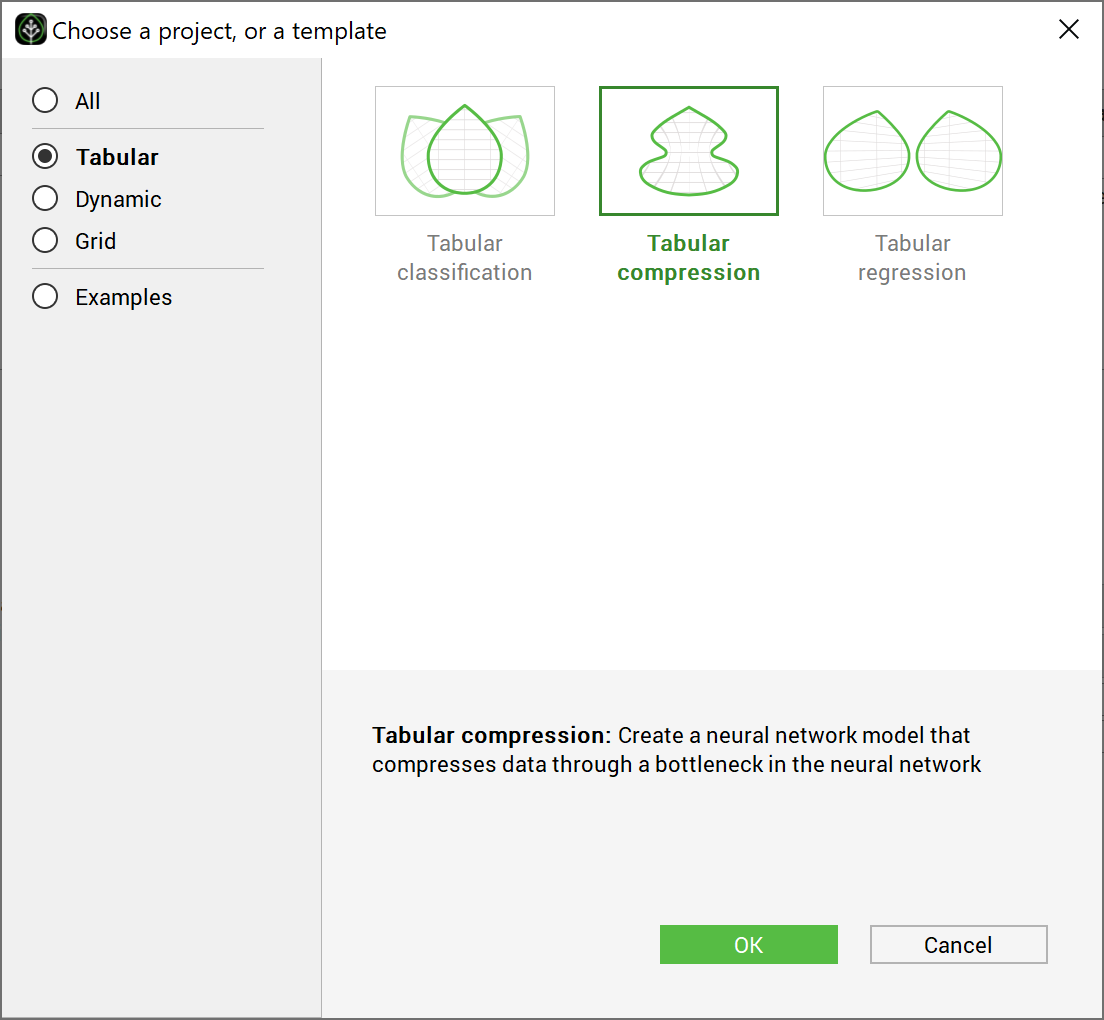
Choosing the test case Heaviside directly from the GUI examples 2#
The main window looks as follows at this stage:
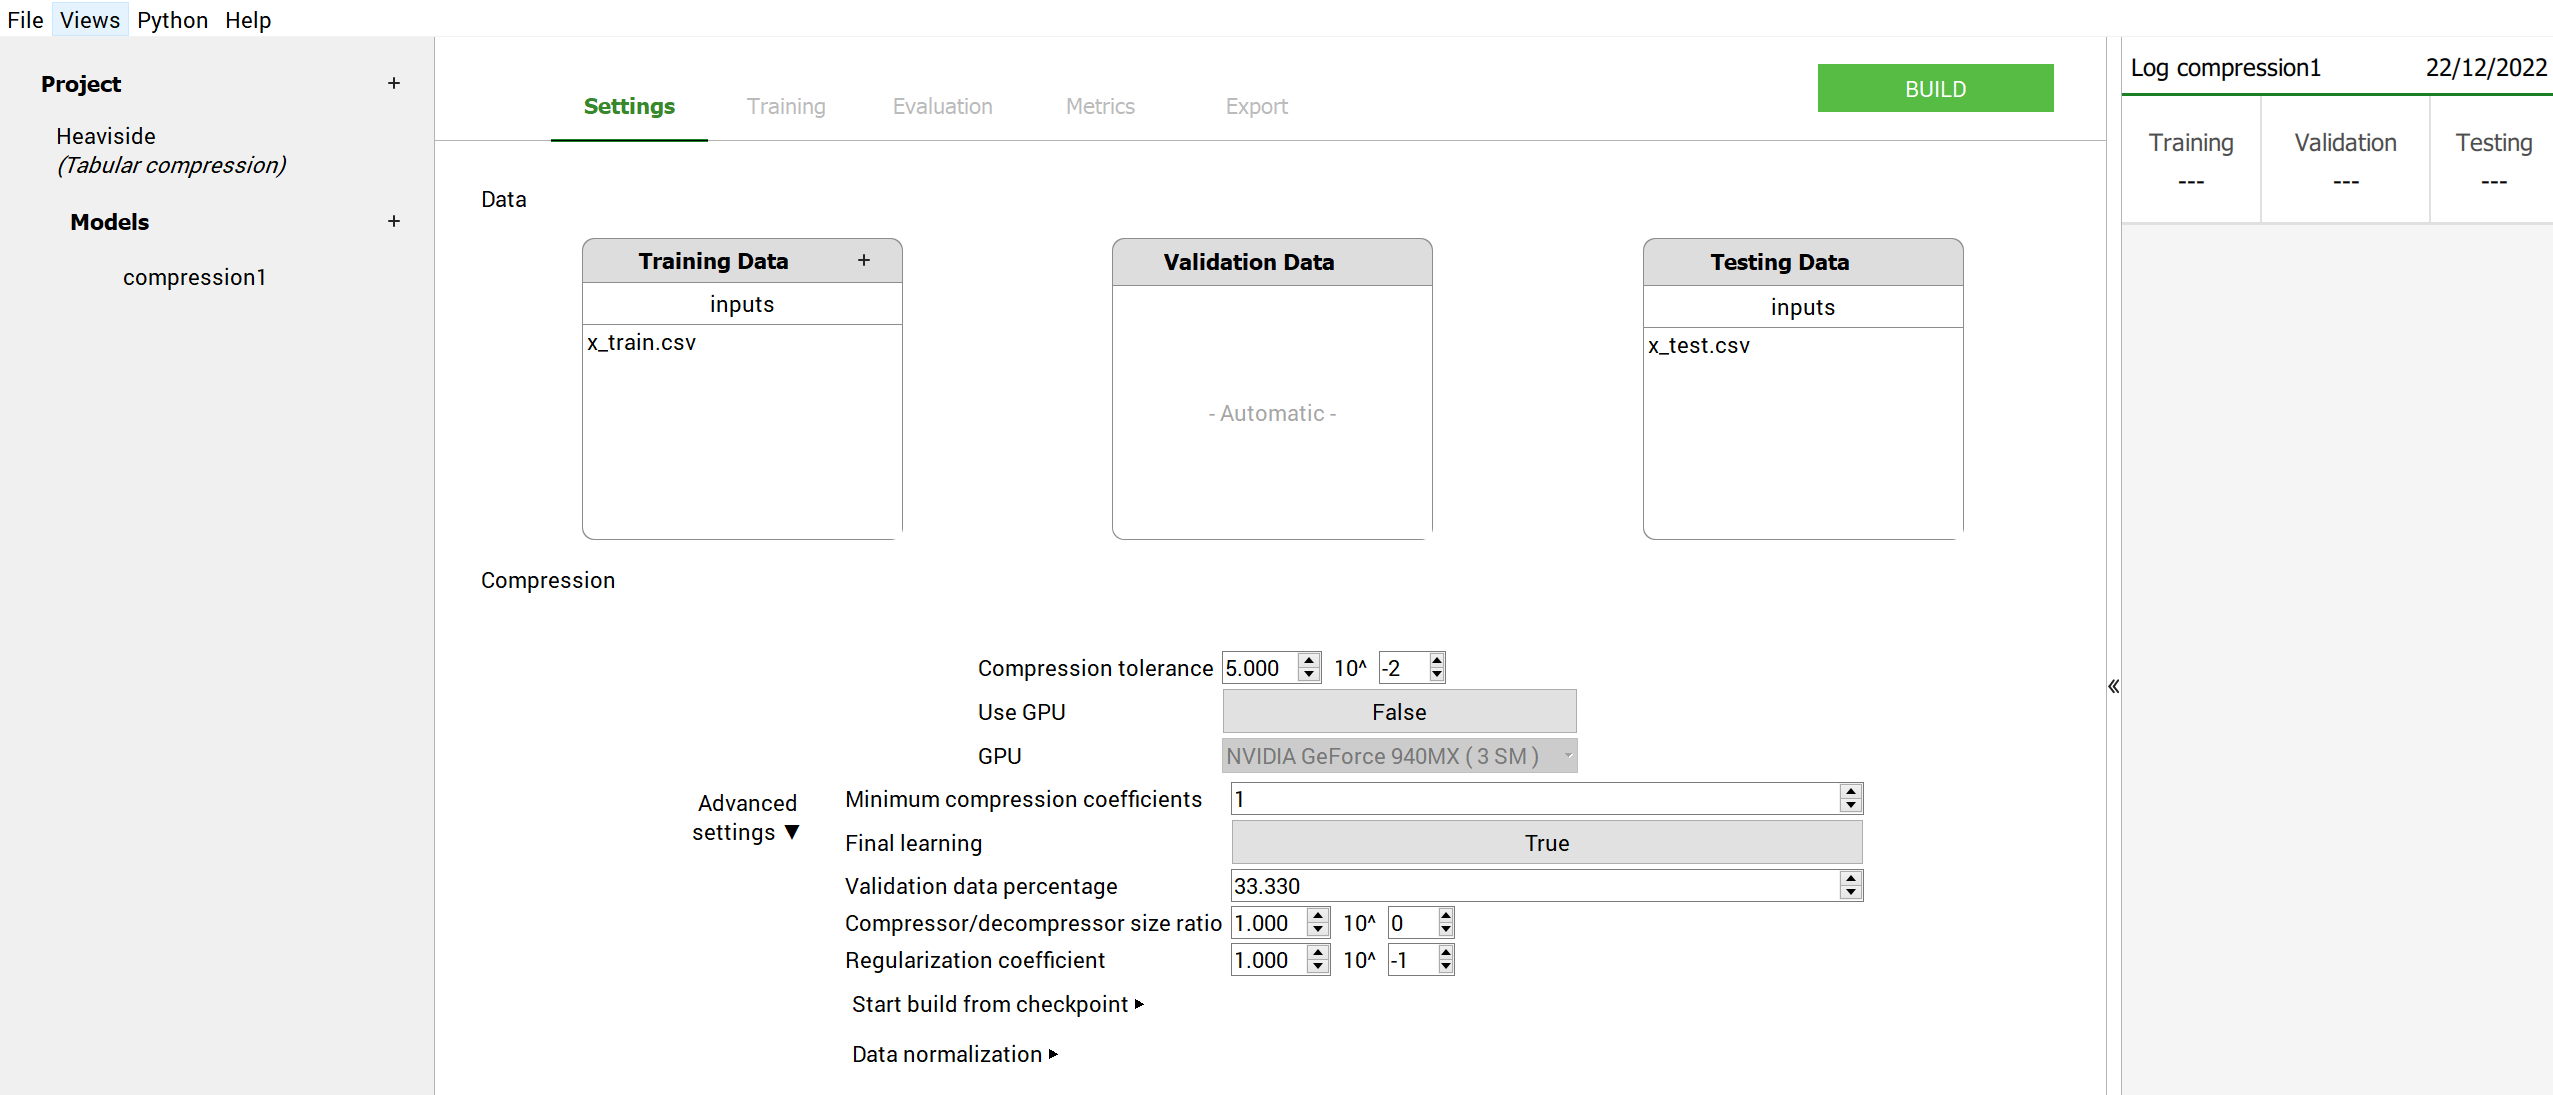
Main window initial look after extracting the data: test case - Heaviside#
To build a model:
Adjust the Settings (add some data for the learning, validation or test, change one or more building parameters (see Build parameters). Here, for Heaviside test case, the Settings keep their default values.
Click on the Build button
During the build NeurEco saves the intermediate modes to the checkpoint file. In term of performance, every new model in the checkpoint is an improvement of the previous one. Note that at the end of the build, the last model in the checkpoint corresponds to the final mode.
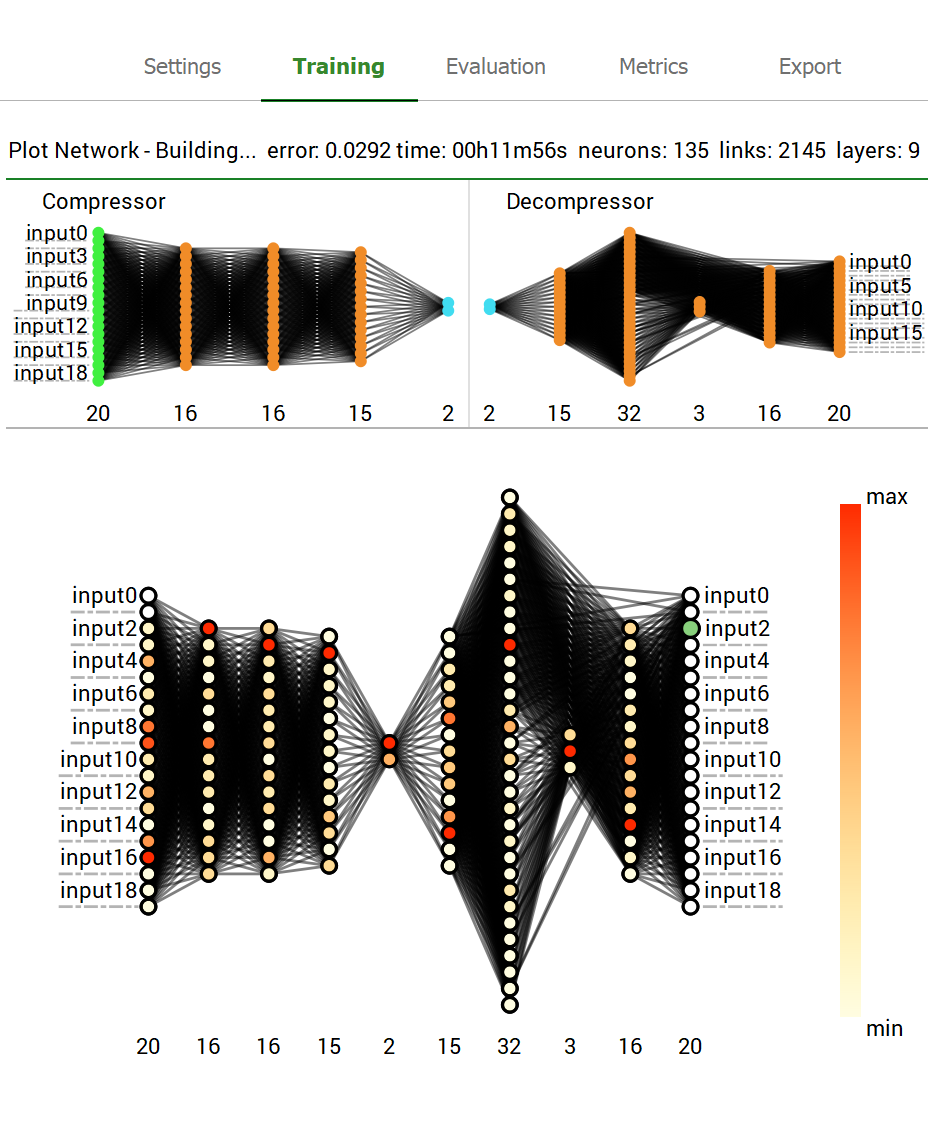
Any intermediate model can be used as if it was the final model: it can be evaluated on the new sets of data, exported, etc. Use the checkpoint slider to select a specific intermediate model. When an intermediate model is selected, the GUI updates the plot of the network architecture, the plot of reference vs prediction, the nonlinear coefficients plot (see Compression coefficients plot and export) and the Sensitivity analysis plot (see Sensitivity analysis for Tabular solutions).
Note
The user can choose which coefficients to plot and whether to have the plots in 3D or 2D. However, if the number of nonlinear coefficients is less than 3, only the 2D option is available.
The compression model could be separated to a c-model (compress) and a d-model (decompress). The GUI displays them separately as well.
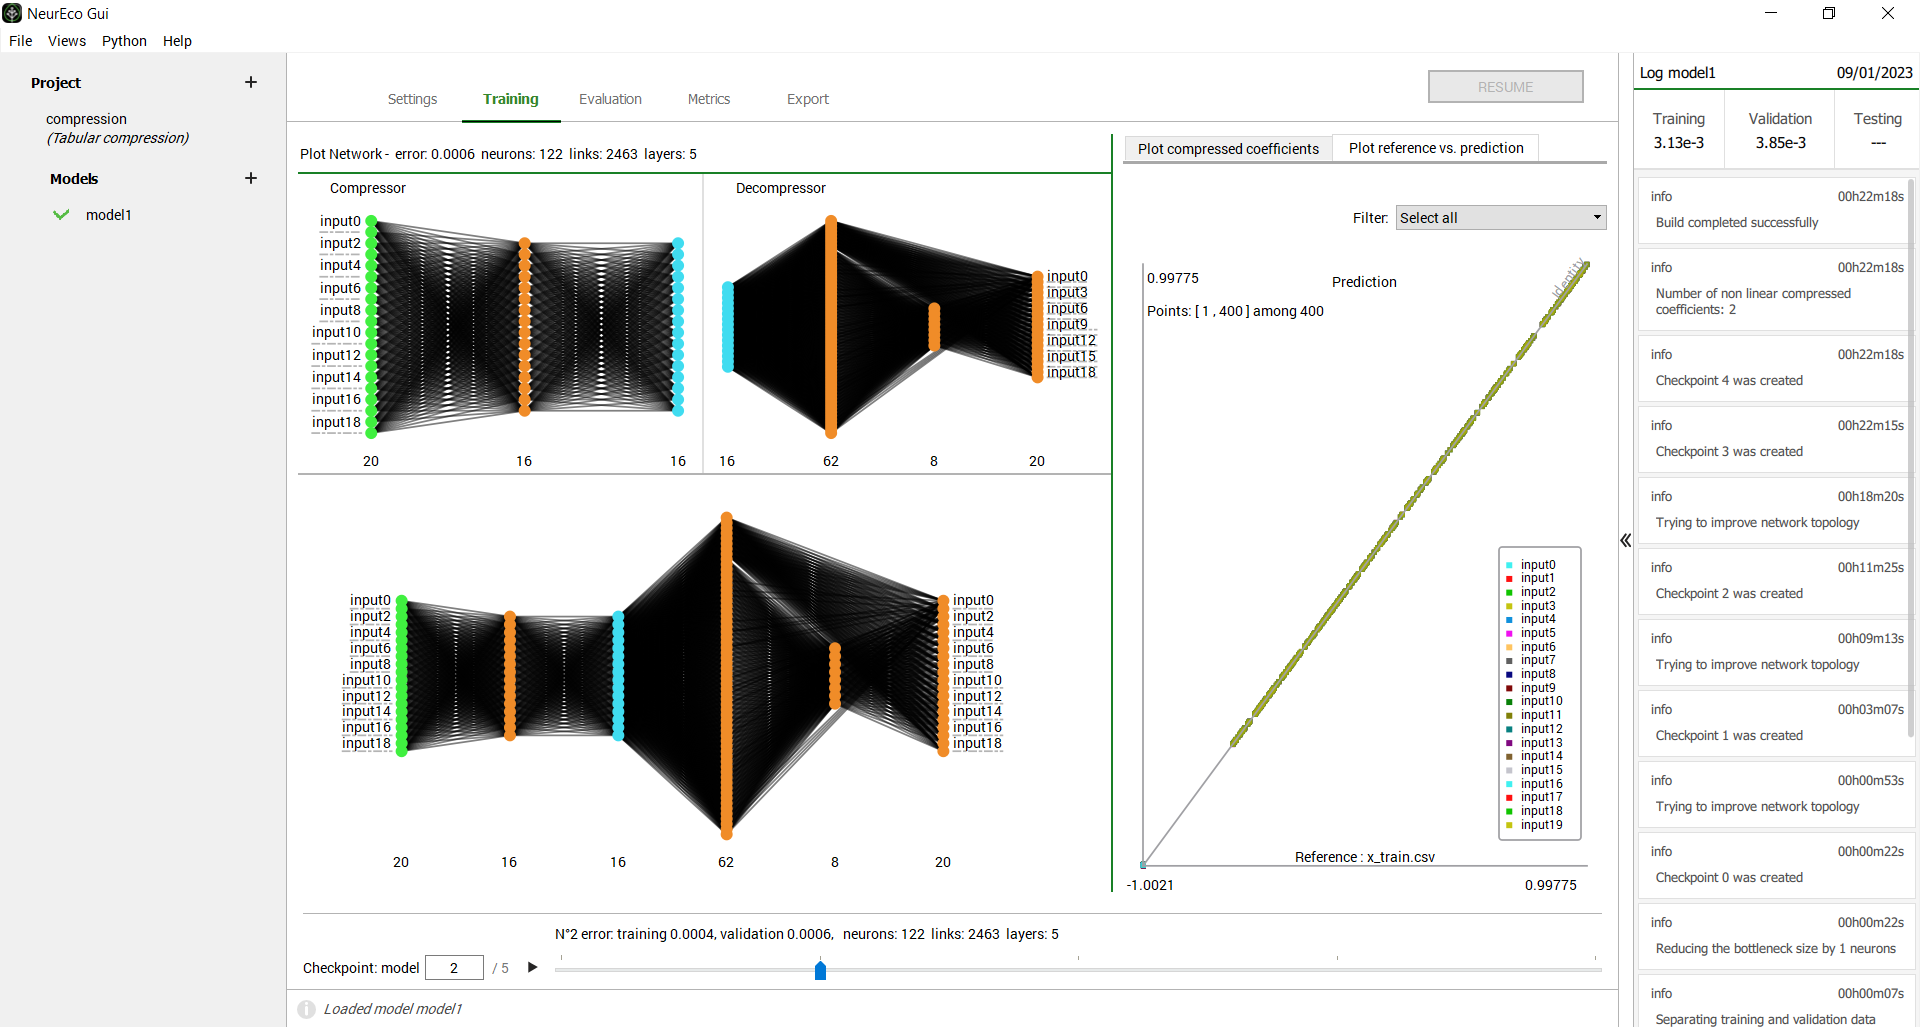
GUI operations: selecting an intermediate model: test case - Heaviside#
Note
The number of links shown by the GUI is the number of trainable parameters in the network. Each link between two neurons represents a parameter, plus there are the bias parameters not shown on the network plots.
To perform a Sensitivity analysis (see Sensitivity analysis for Tabular solutions) on any intermediate model:
Switch to the Metrics panel for Sensitivity analysis for a whole dataset
Switch to the Evaluation panel for Sensitivity analysis for a single sample
Choose an intermediate model using the checkpoint slider
Choose a data set from Evaluation files section (the testing data for this example)
Click on any output node in the Network sensitivity section
The plot displays the sensitivity analysis graph as in figure below:
GUI operations: Performing Sensitivity analysis: test case - Heaviside#
To perform an input sweep (see Input sweep with the GUI):
Switch to the Evaluation panel.
Select an intermediate model using the checkpoint slider. By default, the last model is selected.
Switch to the Input sweep tab.
Select the data set in the Evaluation files section.
Select the sample’s number in the data set.
Select the input to sweep and the output to visualize.
The plot displays the results, as in figure below:
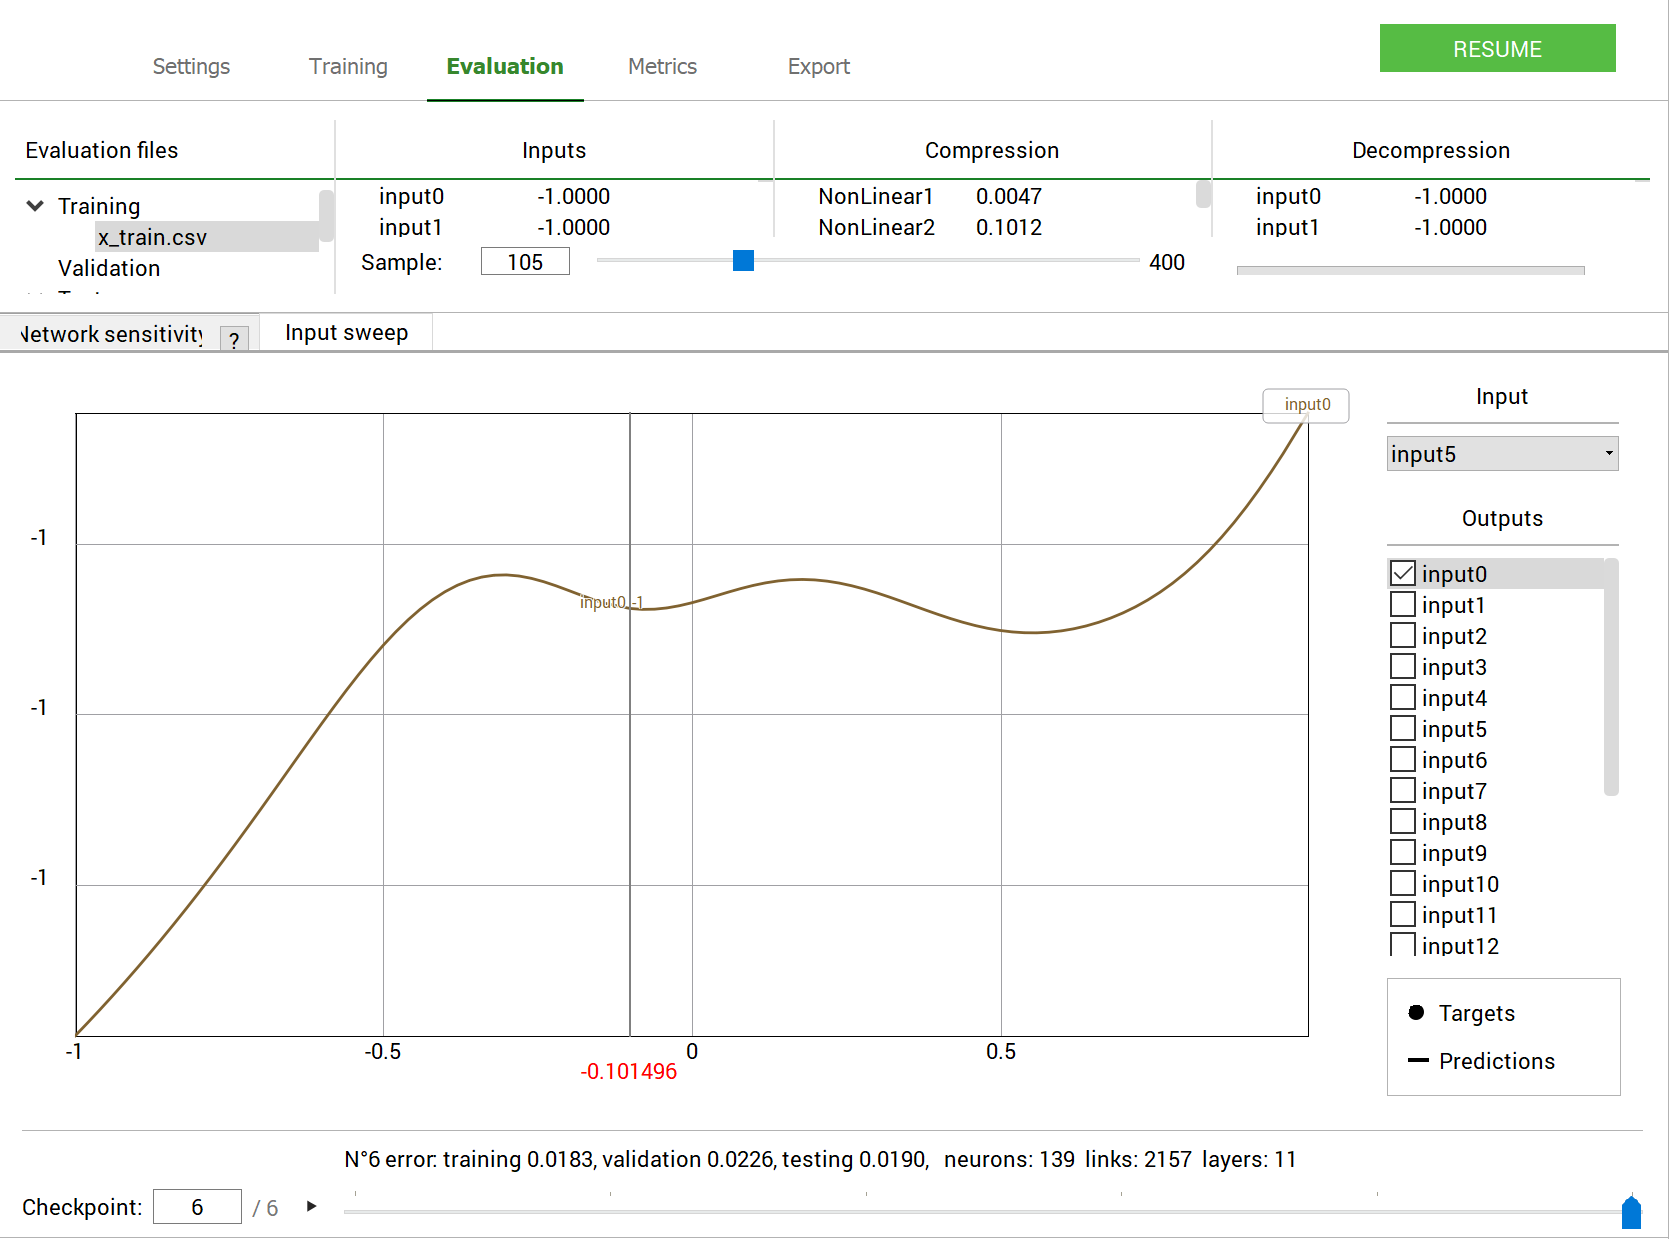
GUI operations: Performing an input sweep: test case - Heaviside#
The Evaluation panel allows a user to load extra sets of data to evaluate the model on and to export the results in a csv or npy format.
The Metrics panel allows a user to calculate a set of metrics (see Metrics for the Tabular Compression model with GUI). For the Compression problems these metrics looks as shown in the figure below:
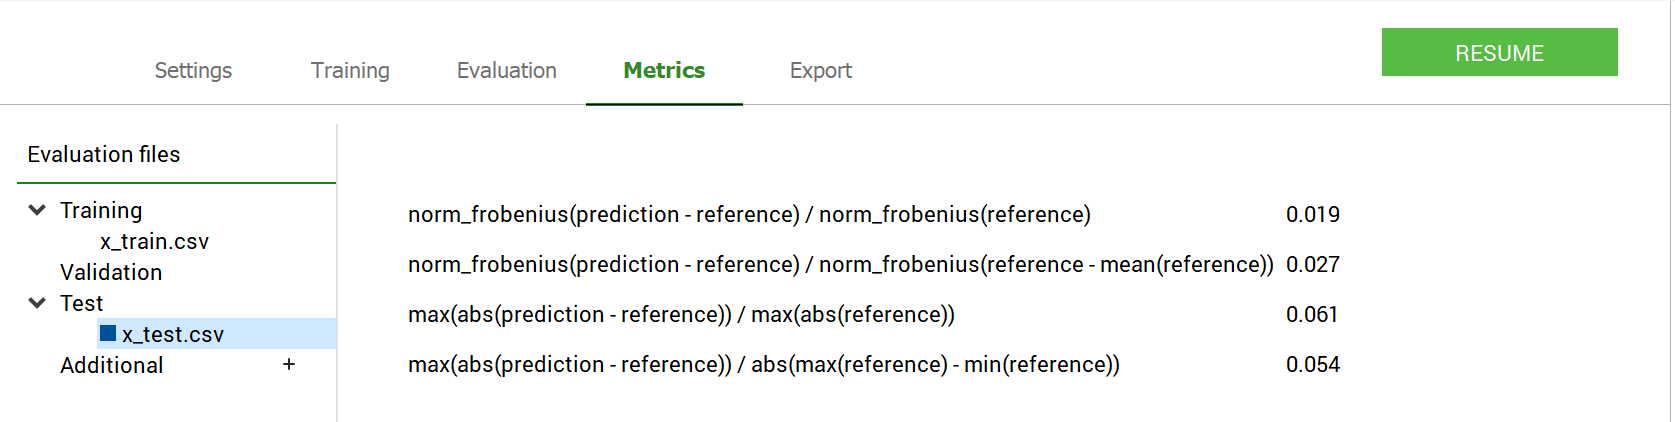
GUI operations: Extracting the metrics: test case - Heaviside#
To export the model (see Export NeurEco Compression model with GUI, embed license is required for export to formats different from NeurEco model):
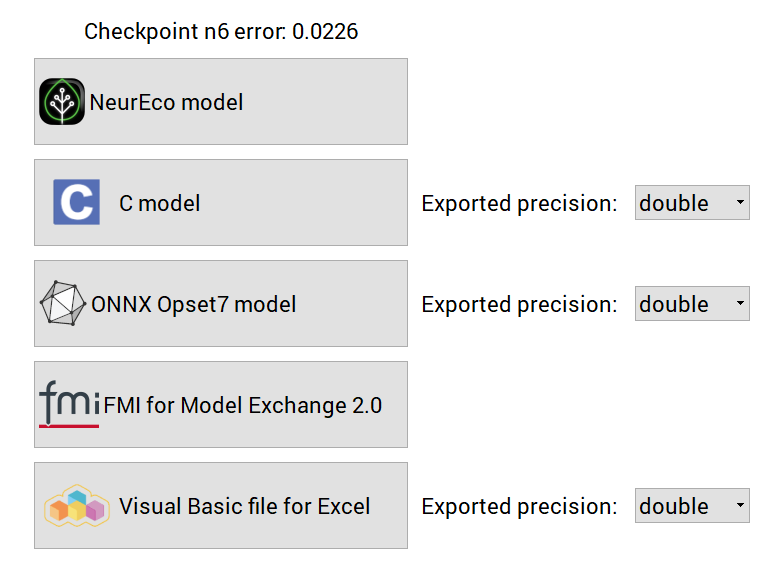
GUI operations: Exporting a model : test case - Heaviside#
Note
When exporting the model under a name file_name, its compression and decompession blocks are saved as well under the names file_name_compression and file_name_decompression. These files contain the NeurEco Regression models and can be used as usual (see Tabular Regression).
To create a Python script reproducing the main parts of the GUI project (see Export Tabular Compression from the GUI to the Python API):
Go to Python/Export NeurEco to Python in the menu bar of the GUI
Choose which parts of the project to export to a Python script
Select the destination where to save the script
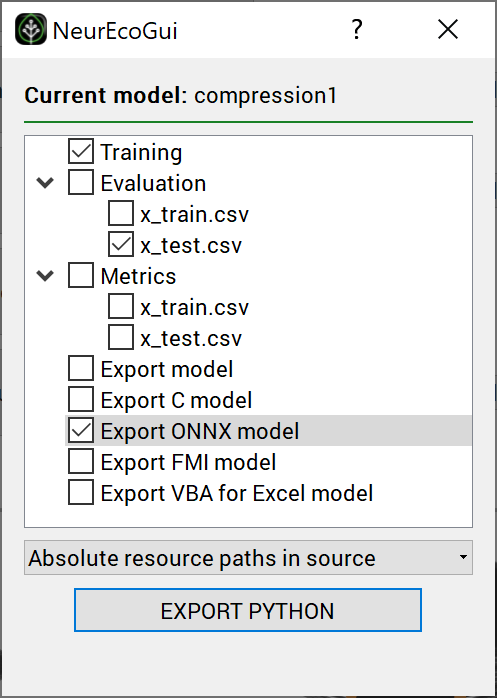
GUI operations: Exporting a python script : test case - Heaviside#
Warning
To be able to use the script exported from the GUI, the NeurEco python API package should be already installed on your computer.