Metrics for the Tabular Compression model with GUI
Metrics for the Tabular Compression model with GUI#
The Metrics tab calculates a set of metrics on the provided dataset.
Metrics, provided for Compression are:
\[\frac{ \|prediction - reference\|_{fro}}{\|reference\|_{fro}}\]
\[\frac{ \|prediction - reference\|_{fro}}{\|(reference - mean(reference))\|_{fro}}\]
\[\frac{max(|prediction - reference|)}{max(|reference|)}\]
\[\frac{max(|prediction - reference|)}{max(|reference|) - min(|reference|)}\]
Switch to the Metrics tab
To calculate metrics, click on the input file in the Evaluation files section. Use Aditional + to add the input files.
The results are displayed, and the Metrics tab provides also a Plot reference vs. prediction for the selected inputs.
An example of a result looks as follows:
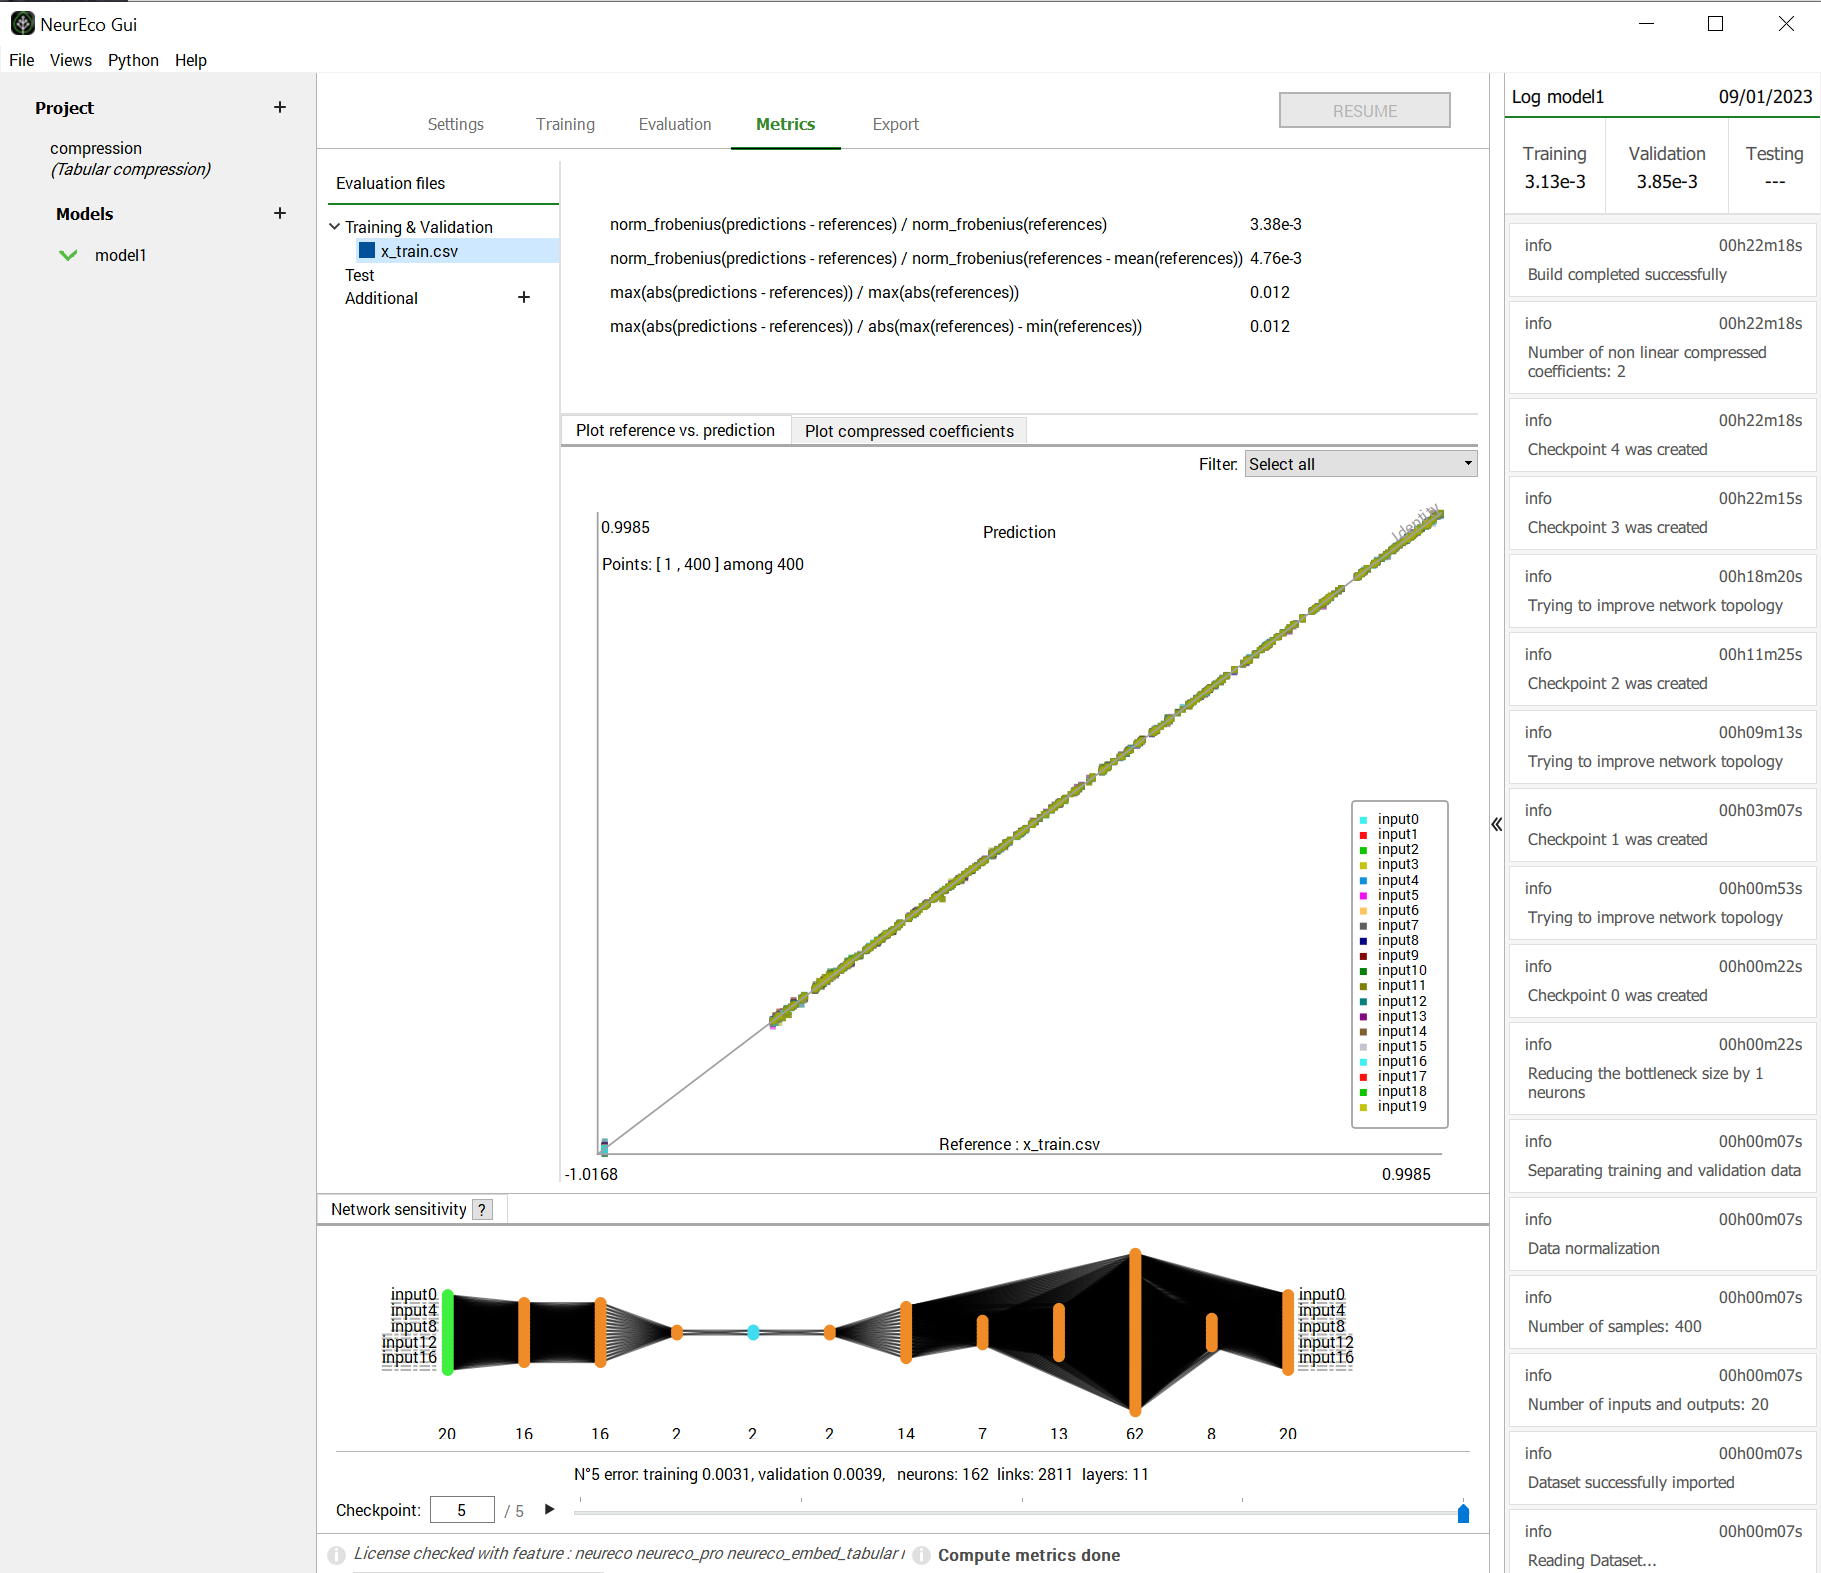
GUI operations: metrics evaluation for Compression, test case Heaviside#
Note
By default, the evaluation of metrics is performed with the last model available in the checkpoint.
Use the checkpoint slider in the bottom to choose any other available model and get its metrics.