Input sweep
Input sweep#
NeurEco offers the user of the tabular solution the possibility to perform an input sweep. Meaning that for each model, when all the inputs except the one to sweep are set to a certain value, it is possible to check the evolution of each output when the chosen input moves across the entire range of its values. The output of this operation is a plot of the chosen output evolution, with an emphasis on the point corresponding to the real input given in the initial sample.
model.perform_input_sweep(x, input_id, input_interval, output_id, n_points=100, show=True, save_path=None)
- perform_input_sweep
all the features of the input sample are set to their values, except the input to sweep which will vary in the input_interval. The method will return a 2D plot \(y = f(x)\) where \(x\) is the n_points of the input to sweep inside the input_interval, and \(y\) is the outputs[output_id] response of the model for each point. Requires matplotlib installed.
- x
a 1D numpy array representing one sample of the data. Its shape is \((n,\ )\) where \(n\) is the number of inputs of the network
- input_id
the id (argument) of the input to sweep in the x array.
- input_interval
list containing the min and max values of the input to sweep
- output_id
the id of the output to plot.
- n_points
the number of points to generate in the input_interval
- show
bool, if true, a matplot.plot.show() will be applied.
- save_path
if not None, will save the figure to this path (must be a png extension)
An example of the input sweep plot is given by the following figure:
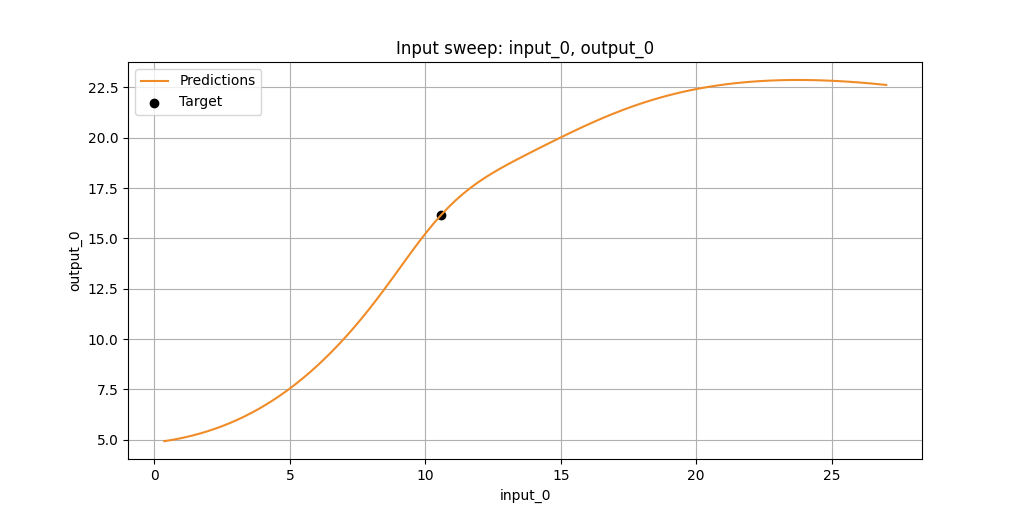
Tabular network input sweep example#